Trading Divergences with Candlestick Patterns
1. Introduction
In Japanese Candlestick Charting Techniques, Steve Nison included a section on using candlesticks with oscillators including stochastics, RSI, and moving average oscillator. According to Steve Nison, oscillators are objective and augment the more subjective candlestick patterns.
In this article, we will focus on trading using RSI and candlestick patterns. RSI measures the momentum of gains and losses.
The relative strength in the formula refers to the ratio of average gain to average loss. These averages are calculated in a way similar to the exponential moving average, before turning the relative strength into an index that fluctuates between 0 and 100.
Other than RSI divergences in our trade setups. Divergences occur when RSI does not support prices. The charts below illustrates RSI divergences, we will also look out for candlestick patterns.
2. Short Entry Rules
3. Long Entry Rules
4. Conclusion
In Japanese Candlestick Charting Techniques, Steve Nison included a section on using candlesticks with oscillators including stochastics, RSI, and moving average oscillator. According to Steve Nison, oscillators are objective and augment the more subjective candlestick patterns.
In this article, we will focus on trading using RSI and candlestick patterns. RSI measures the momentum of gains and losses.
The relative strength in the formula refers to the ratio of average gain to average loss. These averages are calculated in a way similar to the exponential moving average, before turning the relative strength into an index that fluctuates between 0 and 100.
Other than RSI divergences in our trade setups. Divergences occur when RSI does not support prices. The charts below illustrates RSI divergences, we will also look out for candlestick patterns.
2. Short Entry Rules
- A bearish divergence between RSI and the price.
- Sell with a bearish candlestick reversal pattern (Bearish Engulfing / Shooting Star / Bearish Harami) .
- 2.1. Bearish Divergence
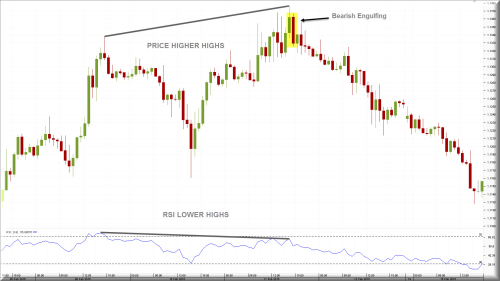
Figure 1. EUR/USD Hourly Chart - bearish divergence and bearish engulfing pattern
- The price is making higher highs, but RSI is making lower highs.
- The bearish divergence occurs at the end of an uptrend. After price makes that second high, if RSI makes a lower high, then you can probably expect a reversal and the price will drop.
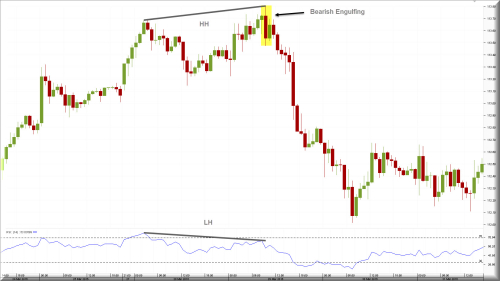
Figure 2. USD/JPY Hourly Chart - bearish divergence and bearish engulfing pattern
3. Long Entry Rules
- A bullish divergence between RSI and the price.
- Buy with a bullish candlestick reversal pattern (Bullish Engulfing / Hammer / Bullish Harami) .
- 3.1. Bullish Divergence
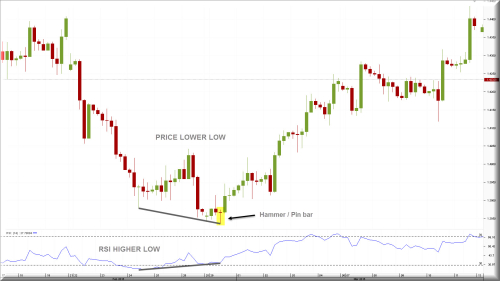
Figure 3. GBP/USD 4 Hours Chart - bullish divergence and hammer / pin bar pattern
- The price is making lower lows, but RSI is making higher lows.
- The Bullish divergence occurs at the end of a downtrend. After price makes a second low, if RSI fails to make a new low, then you can probably expect a reversal and the price will rise.
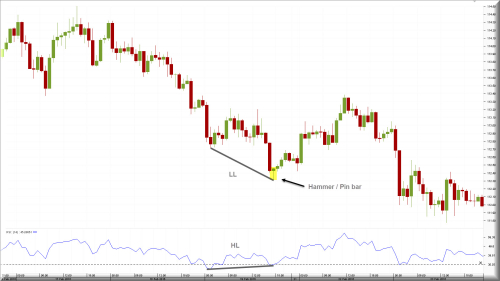
Figure 4. USD/JPY Hourly Chart - bullish divergence and hammer / pin bar pattern
4. Conclusion
- Essentially, this trading strategy of combining RSI divergence and candlestick patterns is a reversal trade setup. Reversal trade setups have a high reward-to-risk ratio. Using RSI divergences to find trends that have exhausted helps to improve the odds of a reversal trade.
- Looking out for candlestick patterns help to pinpoint better entries.
- Pay attention to price action after entry. The best reversals happen swiftly and you should see strong bars in your trade direction within two to three bars of your entry. If not, simply exit with a small loss or profit and wait for better opportunities.
Trading Divergences with Candlestick Patterns
![Trading Divergences with Candlestick Patterns]() Reviewed by Unknown
on
10:56
Rating:
Reviewed by Unknown
on
10:56
Rating:

No comments: