3 Powerful Japanese Candlestick Formations
Japanese Candlesticks, as way to represent the Price data to a particular Financial Instrument in the chart are introduced in the modern financial world by Steve Nison in December 1989 , when he published in Futures Magazine his article "Learning Japanese-Style Candlestick Charting" .
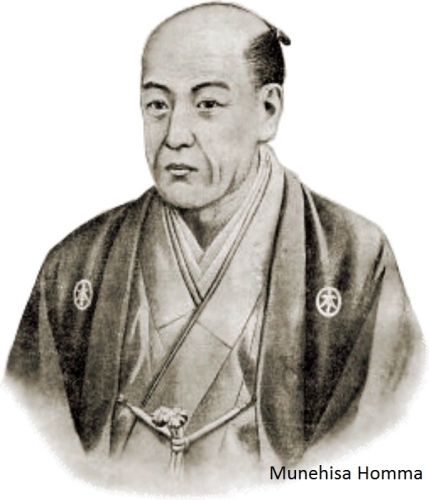
Munehisa Homma (1724-1803) born in Sakata, Japan is the father of the Japanese Candlesticks. He was a successful rice trader at the Osaka Rice Exchange in Japan. Rice was at the base of Japan's economy during that period.
Homma was reported to have 100 consecutive winning trades and was considered the God of markets. He was raised to the rank of Samurai and became a financial advisor for the government.
Homma wrote the 160 rules , named Sakata's Method . These rules form the base of Japanese candlestick patterns we know today . The “what” (price action) is more important than the “why” (news, earnings, and so on). All known information is reflected in the price. Buyers and sellers move markets based on expectations and emotions (fear and greed). Markets fluctuate.
The candlestick's names often refer to the war which was a reality of that time, for example : Three White Soldiers, Gravestone Doji etc.
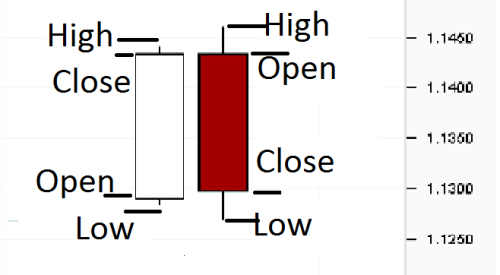
Candlestick charts use the same price data as bar charts (open, high, low, close). However, they are drawn in a much more visually identifiable way typically resembling a candle with wicks on both ends.
The price range between the open and close is plotted as a rectangle. If the close is above the open, the body of the rectangle is white ( empty ) . If the close of the day is below the open, the body of the rectangle is red ( filled) . The high and low are described as shadows and plotted as a single line.
Compared to traditional bar charts, many traders consider candlestick charts more visually appealing and easier to interpret the price action. Hollow candlesticks, where the close is greater than the open, indicate buying pressure. Filled candlesticks, where the close is less than the open, indicate selling pressure. Generally speaking, the longer the body is, the more intense the buying or selling pressure. Conversely, short candlesticks indicate little price movement and represent consolidation.
3 Powerful Japanese Candlestick Formations
Hammer /Shooting Star
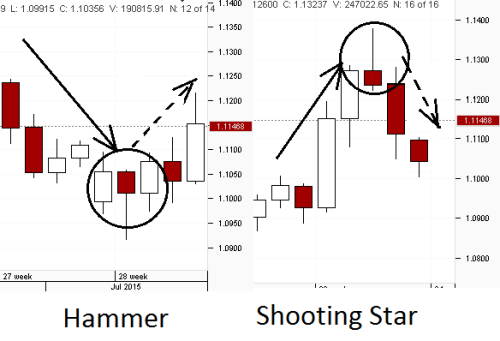
This is One Candle Formation , with short body ( no matter of the color ) and long wick at the direction of the present movement.
Harami (Bullish / Bearish )
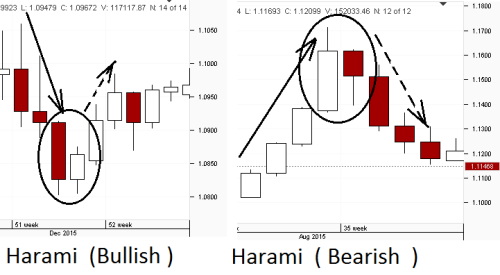
This is Two Candles Formation , with long body of the present direction followed by small one with opposite color .
Engulfing (Bullish / Bearish )
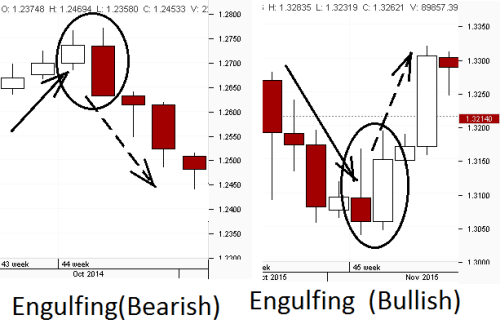
This is Two Candles Formation , with short body of the present direction followed by large candle with opposite color , totally engulfing the previous one .
Trading the Patterns
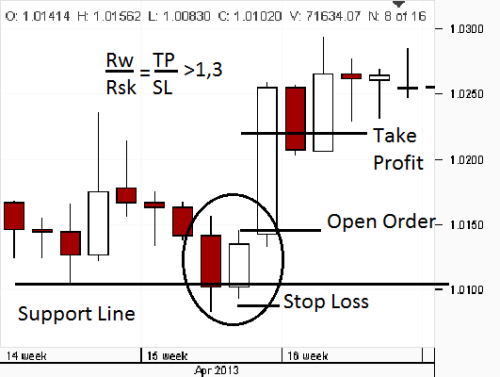
To open a long position ( for short positions - the opposite ) should be placed a pending buy stop order some pips just above the last candle, Take Profit equal to the range of the formation and Stop Loss = 0,77 TP ; to have statistically good Ratio Reward / Risk = TP/SL = 1,3 . If the price go down below the SL level - cancel the order ; if the order is executed - wait to be hit TP ... or SL .
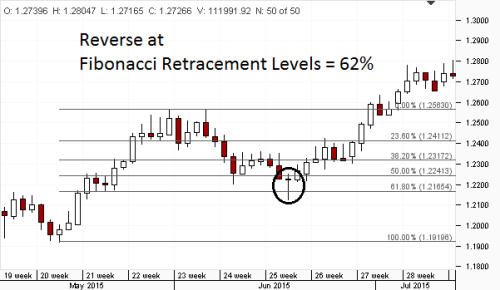
These are Reversal Patterns . To be reliable they should be at some potential Reversal levels as
Support / Resistance Levels ,
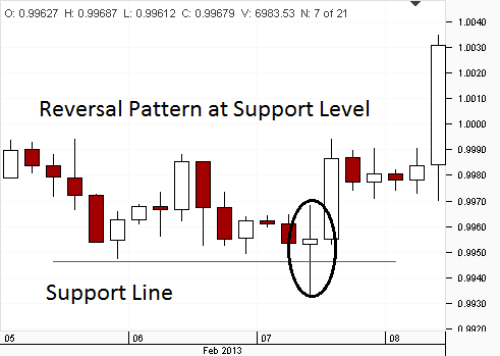
Round Number Levels ,
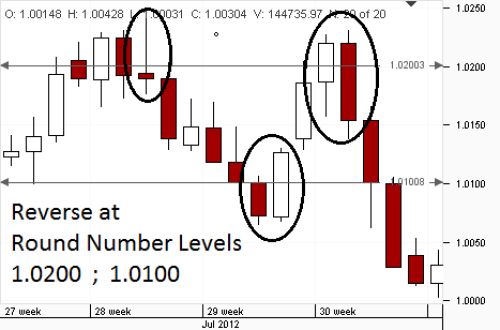
Fibonacci Retracement Levels
Important NOTE :
All candlestick formations are mostly from 1, 2 or 3 candles . That is why it is important to use Time Frame 4H or higher. In TF lower than 1 H there are much market noise and is necessary to be considered another additional factors as time of the day , day of the week, important news announcement ... and so on .
It is good first to trade in demo account these Patterns , to become familiar with the place of the chart where they are reliable , to do a statistic of their performance and to apply Proper Risk Control and Money Management .
Examples Here are some live trading examples , used to describe the efficiency of this strategy .
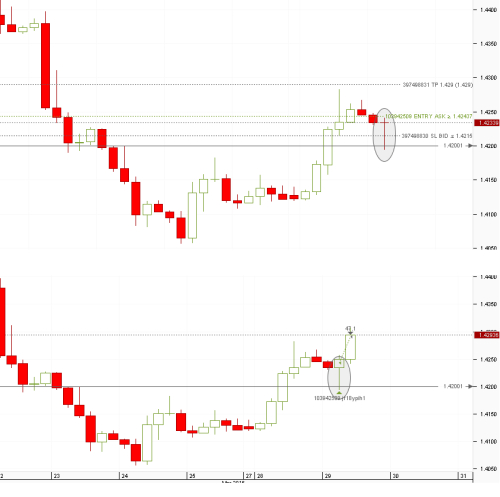
GBPUSD , TF 4 H
On March 29 there is a Hammer, testing Round Number Support Level at 1,4200. Placed Buy Stop Open Order is executed at the next candle ; at the same candle is hit TP too .
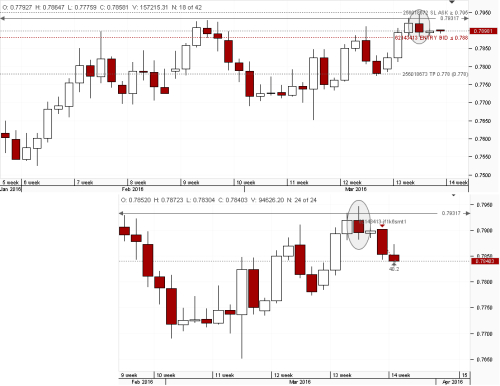
EURGBP , TF1D
On March 23 there is a Shooting Star , testing Resistance Line - previous top at 0,7930.
Placed Sell Stop Open Order is executed two days later and on the third day is hit Take Profit level.
3 Powerful Japanese Candlestick Formations
![3 Powerful Japanese Candlestick Formations]() Reviewed by Unknown
on
09:55
Rating:
Reviewed by Unknown
on
09:55
Rating:

No comments: