Chart Patterns for Trading
Introduction: -Every trader want to make handsome amount of money by trading Stock, currency and various instruments available through trading platform. we should make a plan for each and every trade, If you're going to put money at risk, make sure the reward is high enough to justify the time and effort you put into the trading decision.
Careful and effective use of technical indicators can improve your trading style, chart patterns and technical indicators are patterns and calculations based on particular pair's past, price and volume activity. They help us to predict an instrument's future price and direction of the trend. I am explaining you basics of Moving average a better known indicator in this article.
Moving Average: the moving average is a simple technical analysis tool that smooths out price data by creating a constantly updating average price. The average price is taken over a specific period of time, 15 minutes, 1 hrs. 1 day, 1 week or any other time period that you choose.
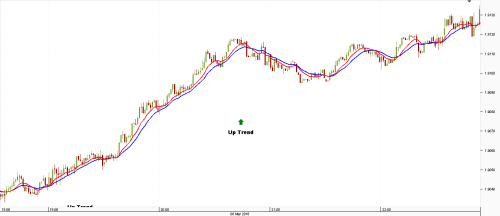
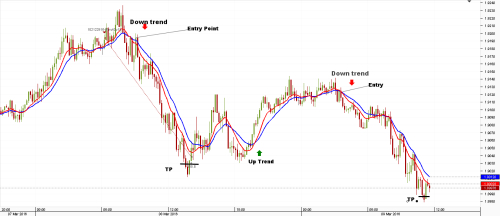
Moving average can help you to identify the direction of price movement or trend, if moving average is going upward and price is also moving up that means trend is up trend as shown in the below picture.
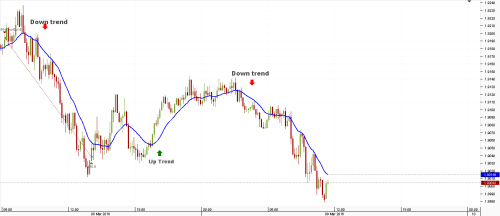
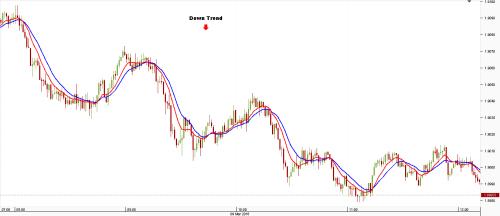
If moving average is going down and price is also going down that means there is a down trend.
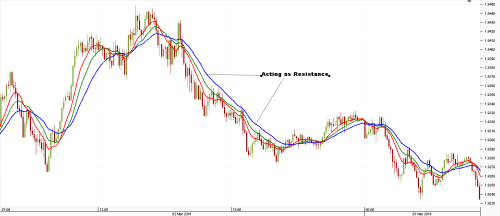
By using moving average you can also find the support and resistance levels generally traders are using 50-days moving average, 100-days moving average or 200-days moving average to find the support or resistance level. they are also used for long term trading plans. In uptrend moving average may work as support level.
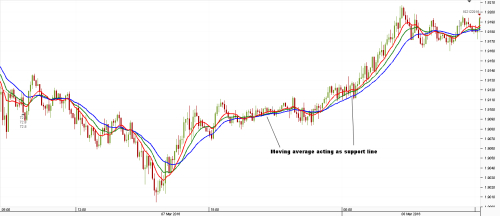
In downtrend moving average line may work as resistance line.
When trade is open you can keep these Support and resistance line as trialing stop loss to protect the gains by enabling a trade to remain open and continue to profit as long as the price is moving in the right direction or in your favor. for example if you have a short position you can keep the trialing stop loss above the 33 bar moving average and exit from the trade when it start trading above of this moving average.
Keep in mind the price won't always respect the moving average as a support or resistance; the price may run through it slightly or stop and reverse prior to touching it. keep certain values in your mind to make any decision for entry or exit in trade.
for this type of market situation you need to take help from some other indicators to identify the support and resistance zone, to keep you active in the trade for good result.
Moving average work quite well in strong trending market but it gives poor result in choppy or range-bound market conditions. Crossover of moving average is a popular entry and exit strategy, its a predictive and easy technical tool to identify the trend and according trade
Careful and effective use of technical indicators can improve your trading style, chart patterns and technical indicators are patterns and calculations based on particular pair's past, price and volume activity. They help us to predict an instrument's future price and direction of the trend. I am explaining you basics of Moving average a better known indicator in this article.
Moving Average: the moving average is a simple technical analysis tool that smooths out price data by creating a constantly updating average price. The average price is taken over a specific period of time, 15 minutes, 1 hrs. 1 day, 1 week or any other time period that you choose.
Moving average can help you to identify the direction of price movement or trend, if moving average is going upward and price is also moving up that means trend is up trend as shown in the below picture.
If moving average is going down and price is also going down that means there is a down trend.
By using moving average you can also find the support and resistance levels generally traders are using 50-days moving average, 100-days moving average or 200-days moving average to find the support or resistance level. they are also used for long term trading plans. In uptrend moving average may work as support level.
In downtrend moving average line may work as resistance line.
When trade is open you can keep these Support and resistance line as trialing stop loss to protect the gains by enabling a trade to remain open and continue to profit as long as the price is moving in the right direction or in your favor. for example if you have a short position you can keep the trialing stop loss above the 33 bar moving average and exit from the trade when it start trading above of this moving average.
Keep in mind the price won't always respect the moving average as a support or resistance; the price may run through it slightly or stop and reverse prior to touching it. keep certain values in your mind to make any decision for entry or exit in trade.
for this type of market situation you need to take help from some other indicators to identify the support and resistance zone, to keep you active in the trade for good result.
Moving average work quite well in strong trending market but it gives poor result in choppy or range-bound market conditions. Crossover of moving average is a popular entry and exit strategy, its a predictive and easy technical tool to identify the trend and according trade
Chart Patterns for Trading
![Chart Patterns for Trading]() Reviewed by Unknown
on
21:18
Rating:
Reviewed by Unknown
on
21:18
Rating:

No comments: