Continuation Patterns: Triangles
Triangles represent one of the most popular patterns. Traditionally, they fall under the “continuation patterns”. Together with flags and pennants, these patterns indicate that the trend is pausing or in the consolidation mode before resuming in the same direction after a period of time. Once the breakout from the triangle happens, it is usually done in an accelerated manner. There are three types of triangles: the ascending triangle, the descending triangle and the symmetrical triangle.
The ascending triangles
In general, an ascending triangle indicates that the market is bullish and currently consolidating. In order to form the ascending triangle, the price has to be supported by a horizontal upward line, while the resistance line is either completely or relatively flat. As the price is going slowly up and the triangle lines converge, the chance of the breakout to the upside increases. Once the price breaks out (picture 1), that may present a signal for the entry point.
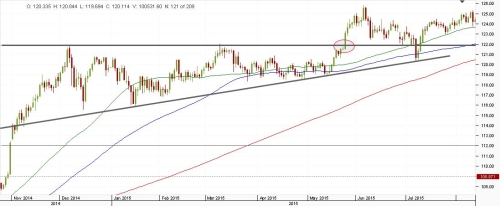 Picture 1. The ascending triangle on EURJPY Daily chart
One of the additional tips may be to look at the volume when the break out happened, i.e. the more volume accumulated within that particular candle, the more authoritative the move is. If you look at the picture 2, the volume of the candle which is leaving the triangle is the biggest in the last 15 days.
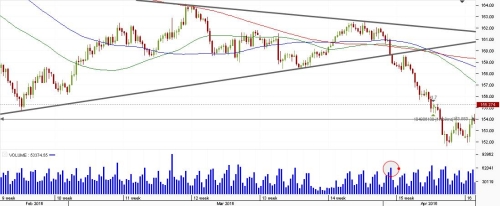
Picture 2. High volume adds to the break down on GBPJPY H4
The descending triangles
Contrary to the ascending, the descending triangles are indicative of a period of consolidation during a down trend. This triangle pattern is the upside-down image of the above-mentioned ascending triangle, which means that the support line is more or less horizontal line while the diagonal line of resistance is falling down and keeping the price under pressure. The price creates lower highs while the energy consolidates more and more in the converging triangle. Again, the break down point indicates a bearish signal and again we must pay attention to the volume (picture 3).
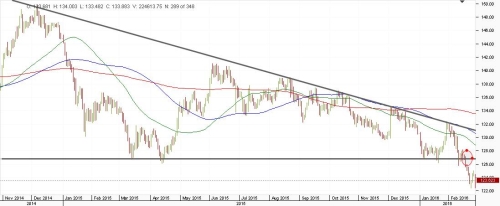 Picture 3. The descending triangles on EURJPY Daily chart
The symmetrical triangle
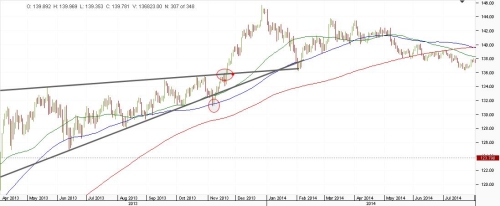
This type of triangle is neutral, which means that the line of support goes upwards while the line of resistance is falling to the down side. The energy is accumulating while the market makes lower highs and higher lows. When the break out or break down happens, prices usually travels a distance equal to the base of the triangle, where you should consider profit taking. What is important for the symmetrical triangles is that the break may happen in both directions.

Picture 4. Symmetrical triangle on GBPJPY H4
In addition, the one has to be very careful with the entry points and he/she should wait for the confirmation of the triangle break. As it can be seen on the picture 5, the false breakdown leads to the explosive break out. Since the bears were not able to follow op on the break to the downside, the bulls used this as an opportunity and created a big bullish move (more than 900 pips).
Picture 5. The false break down leads to break out to the upside
The ascending triangles
In general, an ascending triangle indicates that the market is bullish and currently consolidating. In order to form the ascending triangle, the price has to be supported by a horizontal upward line, while the resistance line is either completely or relatively flat. As the price is going slowly up and the triangle lines converge, the chance of the breakout to the upside increases. Once the price breaks out (picture 1), that may present a signal for the entry point.
Picture 1. The ascending triangle on EURJPY Daily chartOne of the additional tips may be to look at the volume when the break out happened, i.e. the more volume accumulated within that particular candle, the more authoritative the move is. If you look at the picture 2, the volume of the candle which is leaving the triangle is the biggest in the last 15 days.
Picture 2. High volume adds to the break down on GBPJPY H4
The descending triangles
Contrary to the ascending, the descending triangles are indicative of a period of consolidation during a down trend. This triangle pattern is the upside-down image of the above-mentioned ascending triangle, which means that the support line is more or less horizontal line while the diagonal line of resistance is falling down and keeping the price under pressure. The price creates lower highs while the energy consolidates more and more in the converging triangle. Again, the break down point indicates a bearish signal and again we must pay attention to the volume (picture 3).
Picture 3. The descending triangles on EURJPY Daily chartThe symmetrical triangle
This type of triangle is neutral, which means that the line of support goes upwards while the line of resistance is falling to the down side. The energy is accumulating while the market makes lower highs and higher lows. When the break out or break down happens, prices usually travels a distance equal to the base of the triangle, where you should consider profit taking. What is important for the symmetrical triangles is that the break may happen in both directions.
Picture 4. Symmetrical triangle on GBPJPY H4
In addition, the one has to be very careful with the entry points and he/she should wait for the confirmation of the triangle break. As it can be seen on the picture 5, the false breakdown leads to the explosive break out. Since the bears were not able to follow op on the break to the downside, the bulls used this as an opportunity and created a big bullish move (more than 900 pips).
Picture 5. The false break down leads to break out to the upside
Continuation Patterns: Triangles
![Continuation Patterns: Triangles]() Reviewed by Unknown
on
06:21
Rating:
Reviewed by Unknown
on
06:21
Rating:

No comments: